Description
SQ2010 Portable Universal Input Data Logger – A powerful portable data logger for everyday use
The lightweight, battery-powered Grant SQ2010 Portable Universal Input Data Logger features up to 8 analog input channels capable of measuring temperatures at a high accuracy of 0.1%, as well as recording humidity, current, voltage, and resistance. In addition, its 8 digital channels can automatically trigger or stop logging, while 2 alarm/relay outputs provided alarm features.
- Flexible
- Very easy to use
- Economical
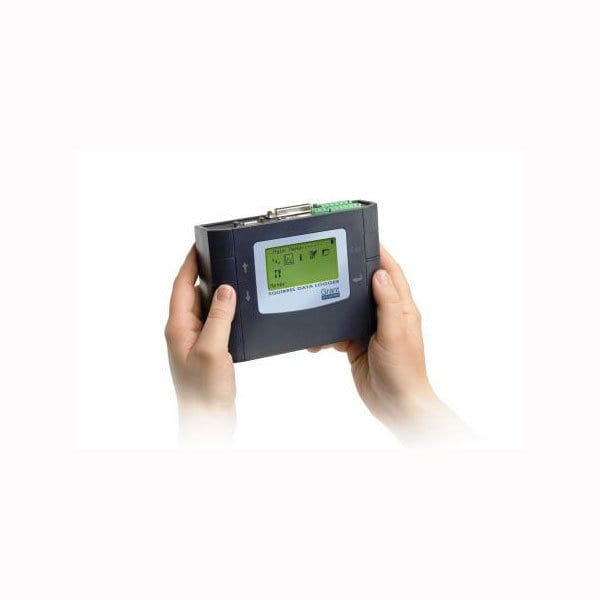
- Handheld, ergonomic design
- USB connectivity with PC
- Ethernet or RS232 communications options available
- Extended battery life for unattended logging
It is a compact, portable logger which is also suitable for bench based and fixed installations. Easily programmed via the four integral push buttons and large graphical display and with a basic accuracy of 0.1%, the Squirrel 2010 is able to fulfill many routine data logging needs, including more demanding applications requiring up to 10 readings per second on one channel.
Analog inputs supported
- Thermistors
- Thermocouples
- Voltage
- Current
- Resistance
The Squirrel 2010 series is comprised of two versions:
SQ2010
Includes the following;
- Fitted Foam Lined Case
- SquirrelView Software
- Getting Started Guide including Certificate of Conformity
- USB connection cable
- Full set of Connection Plugs complete with Cable Ties
- Pack of 4 Precision Resistors for 4-20mA connection
- Set of C type Batteries
- Small Electrical Screwdriver
SQ2010 Kit
Includes all of the above, plus the following items;
- SquirrelView Plus Software
- Universal Mains Power Adaptor (110-240 Vac)
Features
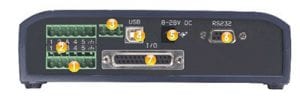 Connections
1. Easy to use, removable connector system
2. 4 to 8 universal analog inputs (4 differential, 8 single ended) for recording temperature, current, voltage and resistance
3. Power output for sensor excitation/external devices
4. USB connectivity for quick and easy PC communication
5. Power supply – internal alkaline batteries, external DC power supply or via USB
6. RS232 or Ethernet communications – for modem or network connections
7. Range of trigger functions via 8 digital inputs; 2 pulse rate / counter inputs; 2 alarm / relay outputs
Front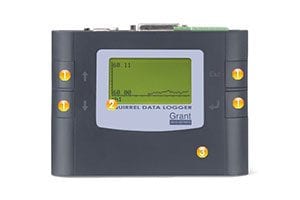
1. Use the four integral push buttons and graphical display to configure the logger – no PC required for operation
2. Display of real-time readings on the large clear graphical display
- Icon driven software and large clear graphical display for easy logger set-up and configuration
3. Store up to 1.8 million readings in the Squirrel’s onboard memory
- Store up to 6 logger configurations in the onboard memory
- Use the convenient free SquirrelView set-up and download software to export stored data to your application
Software
SquirrelView Software
Key features of SquirrelView
- Export data into Excel or as a CSV file for customisable data analysis
- Easily view and control the logger status from one single screen
- Use the simple communication wizard for hassle free working with modems, Ethernet, GSM, etc.
- Download data by date, time or events, saving time when working via modem or looking for specific data
- Save settings on the PC for efficient re-use
- Protect your data and set-up configurations with the security function
For full analysis and reporting facilities SquirrelView Plus is available as an add-on option (a free 30-day trial is included with the SquirrelView software).
Minimum PC specification
Windows® 2000, XP; Pentium II 266MHz, 60Gb HDD, colour SVGA screen, at least one RS232 or one USB port.
SquirrelView Plus Software
SquirrelView Plus has all the features of SquirrelView with the additional benefits of allowing graphical analysis of historical and on-line data, whilst providing advanced reporting options.
SquirrelView Plus allows quick and easily analysis of the Squirrel data in a familiar Explorer navigation-style interface.
Data can be displayed with two different auto scaling Y-axes ─ essential for displaying widely varying data from different sensors on one graph. Particular data of interest can be zoomed into whilst an on-screen cursor can pick out exact values. Data can be shown in a statistical summary with set high and low alarm thresholds. The powerful calculation function allows the creation of “virtual” new channels from existing channels e.g. value from channel 1 added to the average of 10 readings from channel 2 etc.
SquirrelView Plus also incorporates a flexible report generation facility which allows the creation of custom report consisting of a title page with descriptive text, headers and footers, graphs, tabular lists of data, statistics and Squirrel logger set-up information. These can be saved as templates with any of these combinations saving time when preparing similar presentations of data.
Key features
- Flexible data presentation allows you to quickly display and analyse real time or historical data as a line graph, bar chart or analogue gauge
- Graphical alarm and event identification lets you easily identify occurrences around specific analogue or digital events, e.g. a pump switching on
- Quick Graph function lets you quickly and easily view large data files
- Wizards for easy set-up of communications and data export
- Ability to send real time metered data from the Squirrel directly into Excel
- Downloader for automating data download using MS Scheduler® (Squirrel 2010, 2020 and 2040 only).
- Fully configurable data views
- Flexible zoom feature including X and Y axes
- Customisable report facility: print out graphs, readings, etc.
- Tolerance curve
- Calculated channels
- Product cure calculation
- Display oven profiles and oven zones


Reviews
There are no reviews yet.