
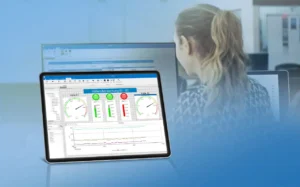
 ProfiSignal 20 is a modern software package designed for the comprehensive evaluation of measurements collected from any Delphin data acquisition and data logging system, enabling users to easily visualize, analyze, monitor, and control their processes. ProfiSignal 20 offers true platform independence, allowing seamless use on desktop PCs, servers in data centers, tablets, and smartphones.
ProfiSignal 20 is modular, scalable, and available in two versions:
- ProfiSignal 20 Go: For quick visualization of measured data in detailed graphical charts with just a few clicks.
- ProfiSignal 20 Basic: Enables the creation of sophisticated and detailed visualizations of installations and processes along with easy process control.
The latest ProfiSignal 20 update delivers 5 significant enhancements designed to further extend the software’s powerful functionality:
- Sequencer – The Sequencer is a powerful tool for automating your test sequences. You can create any number of target value curves and run them automatically. You also have the option of using loops to run through sequences several times and to pause sequences until target values have been set. This allows you to implement your individual application without any programming effort, for example for burn-in tests or other quality tests of your products.
- Color diagram – With the Y(x) color diagram you enter the third dimension. You can now display the relationships between three measurement channels very easily – channel 1 provides the x-value, channel 2 the y-value, and channel 3 the color for the respective data point. With the Y(x) color diagram. For instance, clearly display the correlation between location and temperature, allowing for the immediate identification of key relationships.
- Bar Charts – The new Y(t) bar chart offers an alternative to the traditional Y(t) diagram, representing measured values as vertical bars originating from the x-axis. This representation is ideal for quickly understanding the evolution of a measured variable’s absolute value over time. The Time-independent bar chart displays the most recent measured values for each channel as bars, independent of a time axis. Users can configure the number of the last ‘x’ values to be displayed.
- Comments/Markers – Enhance your Y(t) diagrams with comments and markers to highlight and describe key measuring points. A special feature is that these markers can also be saved in the associated measurement files and reappear when they are reopened. This makes your work much easier during analysis.
- Alarm Table – In the Alarm table you can display all pending and acknowledged alarms clearly at a glance. Alarms and alarm classes are easily configurable within the Data-Service or Delphin Data Center, requiring minimal programming effort.
Other highlights of the ProfiSignal 20 Software:
- Fully platform independent: Optimized for desktop PCs, laptops, tablets, and smartphones with Windows, Android, and iOS operating system support.
- Graphical portrayals for a wide range of applications.
- Powerful measurement data portrayals with instant and smooth transition between live and historical data.
- SCACH function: Simply scan a barcode with your mobile device to open machine and plant-specific measurement data and visualizations.
- Modern interfaces and operating designs: Adapted to the look and feel of the relevant platform.
- Beginner and expert modes to match individual needs.
To learn more about ProfiSignal 20 software, or to find the ideal solution for your application-specific needs, contact a CAS Data Logger Applications Specialist at (800) 956-4437 or request more information.