

Description
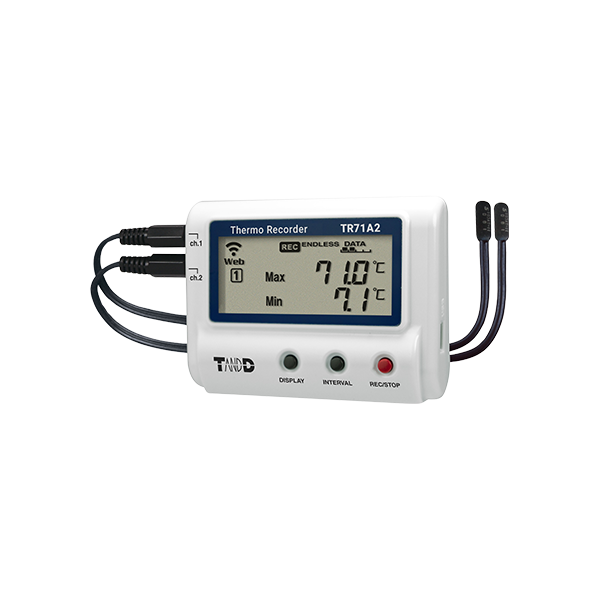
The TandD TR71A2 Wireless Bluetooth Temperature Data Logger
The TR71A2 with two sensor connections can measure temperatures from -60°C up to 155°C. The wide range of optional sensors provides increased measurement flexibility. The LCD screen allows the simultaneous display of the current values of two channels, the highest and lowest values of channel 1, or the highest and lowest values of channel 2. The ALM icon on the LCD screen alerts the user of the occurrence of an alarm.
Use the wireless LAN feature (compatible with Enterprise communication) to auto-upload data to the cloud for any time, anywhere access and receive warning notifications. You can configure device settings, generate reports, download data, and view the uploaded data using Bluetooth or USB. A USB cable is not included and can be purchased as an add-on accessory.
TR71A2 Operational Differences by Measurement Mode
| Normal Mode | Vaccine Mode | |
|---|---|---|
| Max/Min Values | Max/Min temperature reading since the start of recording or reset (via buttons or software/app) | Max/Min recorded value since the start of recording or reset (via buttons or software/app) |
| Warning Judgment Time | 30 sec to 60 min (9 selections) A warning will be issued when a measurement exceeds the set threshold value or a sensor error occurs for longer than the set judgment time. |
0 sec. If a recorded value exceeds the set threshold value or if a sensor error occurs, a warning will be issued. |
| Warning Display [ALM] Icon | Warning alarms for exceeding a set upper and lower limit and for sensor errors will both disappear when the warning condition is resolved. | Warning alarms for exceeding a set upper and lower limit will not disappear even after a value returns to within the threshold range. Warning alarms for sensor errors will disappear upon return to normal. |
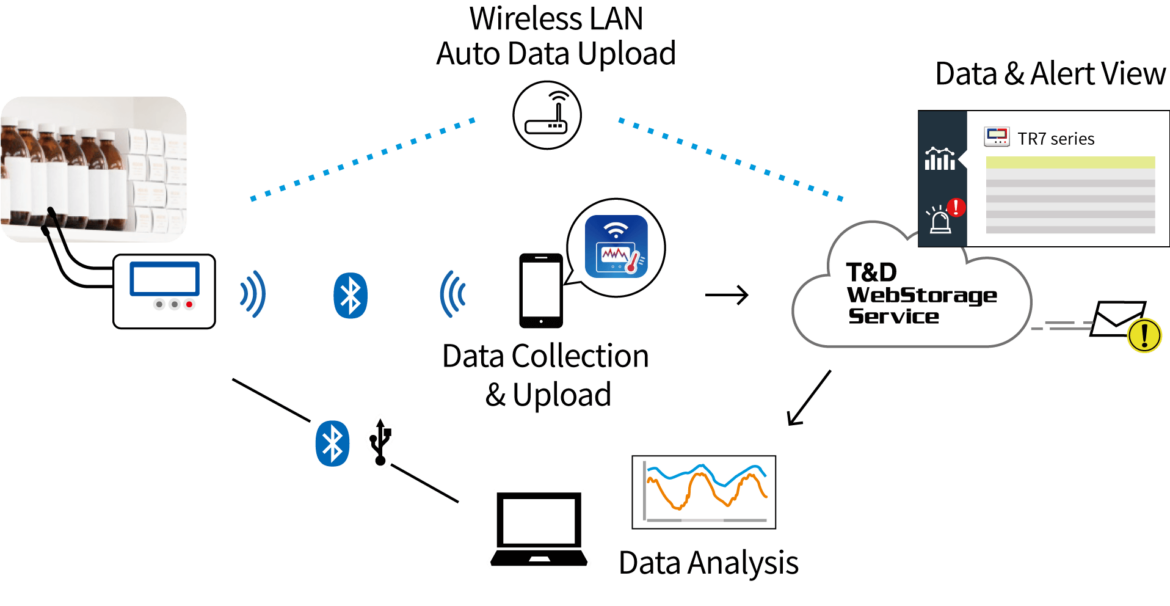
The TR71A2 uses a wireless LAN access point to auto-upload recorded data and warning notifications to TandD’s free-of-charge cloud-based “T&D WebStorage Service”. You can download data and configure device settings using TandD’s dedicated app “TR7 for Windows (for Windows)” or “T&D Thermo (for smartphone / tablet)“. By using their Windows software “T&D Graph”, you can easily view and analyze data from a PC.
Reviews
There are no reviews yet.