
Description
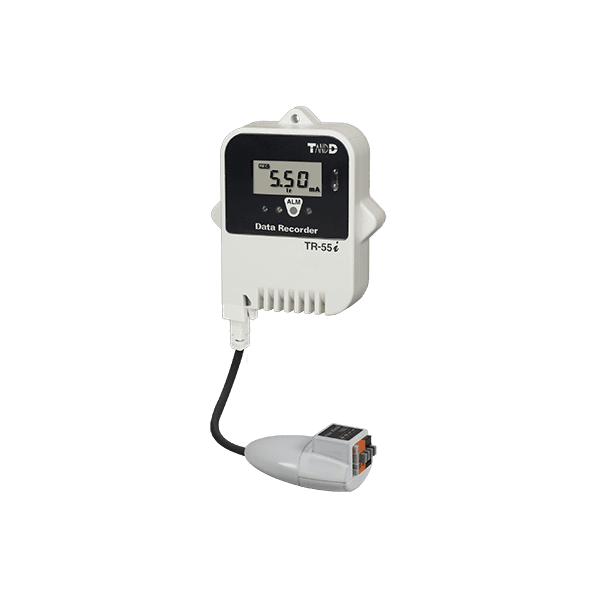
The TR-55i-mA Infrared 4-20mA Data Logger measures and records current readings with an external sensor. 1 to 20 mA measurement range with a ±0.05mA accuracy. Stores up to 16,000 sample readings on the logger, with a sample rate of 1 second to 60 minutes. Features blinking LED indicator when upper or lower alarm thresholds are met. The body is water resistant when the Input Module is connected.
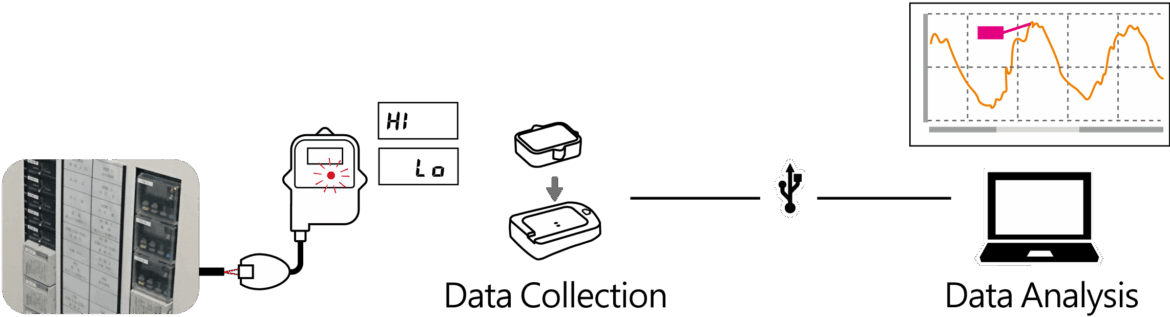
Recorded data can be transferred from the TR-55i-mA to a PC separately via the TR-57DCi Data Collector or the TR-50U2 Communication Port. From there data can be analyzed or viewed in graph form.
With dimensions of 62 x 47 x 19mm (2.4 x 1.8 x 0.75in), TR-5i series loggers may be small, but they are built to last. In addition to the LCD on the front panel, the built-in alarm LED makes warnings easily visible.
The TR-55i-mA can measure and record analog signals output from instrumentation such as sensors in a range of 4-20mA.
The TR-55i-mA is Ideal for recording analog signals output from various measuring devices in research and development and manufacturing.
By connecting our Communication Port TR-50U2 to your PC via a USB cable, you can easily download data by placing the logger face down on the port. Data downloaded to your PC can then be viewed and analyzed with our Windows compatible software “T&D Graph”.
When checking data on your PC, it is possible to apply scale conversion and view data values in the unit of your choice.