
Introduction
A common application for a data logger is to record load cell measurements for force or weight. A load cell uses one or more strain gauges packaged in a physical assembly that converts force into mechanical strain in a known, linear way. From the perspective of the data logger, capturing data from a load cell is simply a strain gauge or Wheatstone bridge measurement.
At a fundamental level, measuring a strain gauge is a resistance measurement, but the change is very small, typically on the order of a few hundred or thousand parts per million (PPM). Most load cells are configured with four strain gauges, one on each arm of the bridge, to improve measurement sensitivity.
Measurement Setup
A Wheatstone bridge consists of four strain gauges arranged as shown in Figure 1 below:
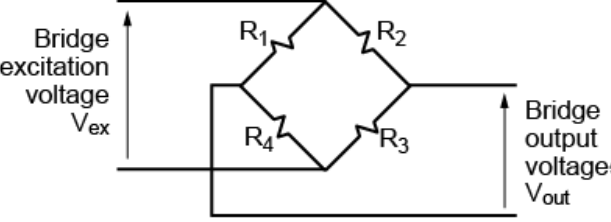
Figure 1. Wheatstone Bridge Diagram
Bridges are designed such that, with no load applied, the ratios R_1/R_4 and R_2/R_3 are equal, resulting in a zero output voltage (Vout). A small change to one of the resistances will then cause a corresponding change to Vout, which can be accurately measured using the data logger.
Strain gauges are what are known as ratiometric devices, which means that the output voltage is proportional to both the applied load and the excitation voltage. The output of a load cell (bridge) is usually given by the manufacturer in mV/V, which is the output voltage over the excitation voltage at the rated load. For example, a 1000-pound load cell might be specified as 2mV/V. This means that if you apply an excitation voltage of 5.0V and a load of 1000 pounds, the output would be: (2mV/V)*5.0V=10textmV
dataTaker data loggers have a built-in channel type for strain gauge measurements called a bridge measurement. Because this involves measuring resistance, some form of excitation is required. The dataTaker can be programmed for either voltage excitation (using an onboard or external source) or current excitation (using its internal source).
Voltage excitation is the most common method for strain gauges, but it requires accurate measurement of the excitation voltage value to get accurate results. Additionally, voltage excitation is not ideal for applications where the datalogger is separated from the load cell by long cables. Even though the current associated with the excitation is small, the resistance of long runs of cable will result in a voltage drop causing a loss of accuracy unless a six-wire configuration is used to allow remote sensing of the excitation voltage directly at the load cell. Current excitation is better for long cables because knowing the excitation current and strain gauge resistance allows you to accurately calculate the excitation voltage, although interpreting or scaling the data is slightly more complex.
The dataTaker’s default output for bridge measurements is in PPM, which is the output voltage of the bridge divided by the excitation voltage, multiplied by 10E6. In the example above with the 1000-pound load, the data logger would return: (10mV/5.0V) *1.0E6 = (0.01V/5.0V) * 1.0E6=2000PPM
 There are two important considerations for bridge measurements:
- Zero-Load Offset: The output voltage (Vout) at no load is usually not exactly 0 volts. This is due to residual stress in the load cell and slight resistance mismatches between the four strain gauges. If the load cell will be used in a fixed application where the zero-load output is not expected to change, this offset can be entered as the channel factor in the measurement setup. However, if the load cell is used in a scale, the program will need the ability to capture the current value and then use it in a tare calculation.
- Calibration: The output is typically not exactly n.000mV/V but may vary slightly from unit to unit due to manufacturing tolerances. While it is possible to use the reported output coefficient, it is best to calibrate the system using a known load. Similar to the zero offset, you can take a known load measurement and then set up the math via scaling or use the logger’s calculation capabilities to provide a calibrated output.
Example
The example below shows how to set up a load cell using the dEX 2.0 programming software for the dataTaker with the built-in bridge channel type:
In this example, we are using voltage excitation with the logger’s built-in voltage source. To improve measurement accuracy, the data logger will internally perform a second measurement of the actual excitation voltage applied to the bridge and use this value in the final calculation. As mentioned before, the bridge measurement will return the result in PPM by default.
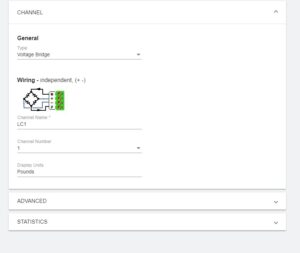
Figure 2. Bridge Measurement Configuration
To convert this value to a calibrated value in pounds, the data logger provides a built-in scaling function.
To use this scaling function, follow these steps:
- 1. Take a measurement with zero load applied and record the value.
- 2. Take a second measurement using a known load and record both the known load and the measured value.
In this example, a measurement of zero load returned -1.2 PPM, and applying a 500-pound load returned 501.5 PPM. These values are entered in the Span configuration as shown below, where “Measured” is the result returned by the datalogger and “Physical” is the actual value applied to the load cell.
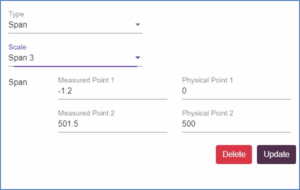
Figure 3. Span Configuration
Summary
Measurement of load cells, which employ strain gauges in a Wheatstone bridge, is a common datalogging application. The dataTaker dataloggers provide a built-in channel type along with voltage or current excitation to capture data from a load cell. Accommodating the zero-load offset and small changes in output calibration can be easily accomplished using the built-in scaling and calculation capabilities of the logger to simplify measurement setup and obtain accurate results.
For more information on dataTaker, or to find the ideal solution for your application-specific needs, contact a CAS DataLoggers Application Specialist at (800) 956-4437 or request more information.