TandD TR-55i-P

  • Pulse Count: 0 to 61439
  • Signal Input: Contact Input/Voltage Input
  • Input Frequency: 0 – 3.5kHz
  • Input Cable Included
  • Logging Capacity: Up to 16,000 Readings
  • Low energy consumption for long battery life
  • Downloading Data: Infrared Communication / Optical Communication
  • Warning Monitoring Function
  • A 9.5% Tariff Surcharge will be added to this item at checkout

$149.00

Normal delivery 1-2 weeks

Description

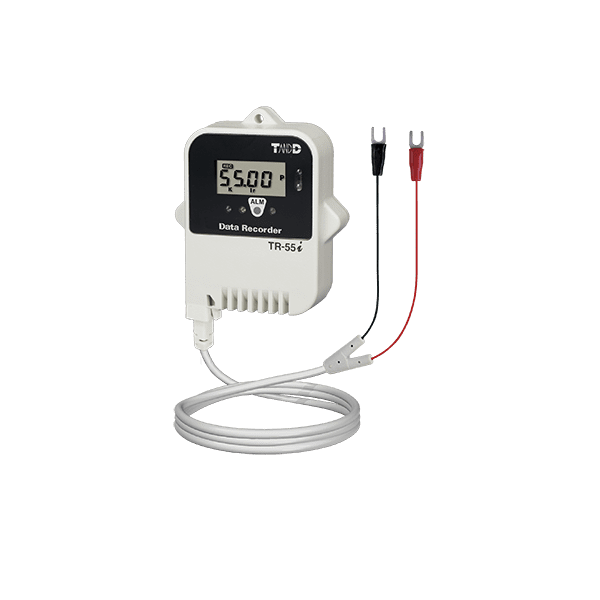
With dimensions of 62 x 47 x 19mm (2.4 x 1.8 x 0.75in) TR-5i series loggers may be small, but they are built to last. In addition to the LCD on the front panel, the built-in alarm LED makes warnings easily visible. The TR-55i-P Infrared Pulse Data Logger can be used with voltmeters, flow meters, and passage counters. TR-55i-P counts pulse signal output from sensors, measuring devices, and control devices and records them at set regular intervals. It is perfect for recording the number of rotations of gears, fans, and/or rollers, and checking the flow rate of liquids during both research and development and manufacturing.

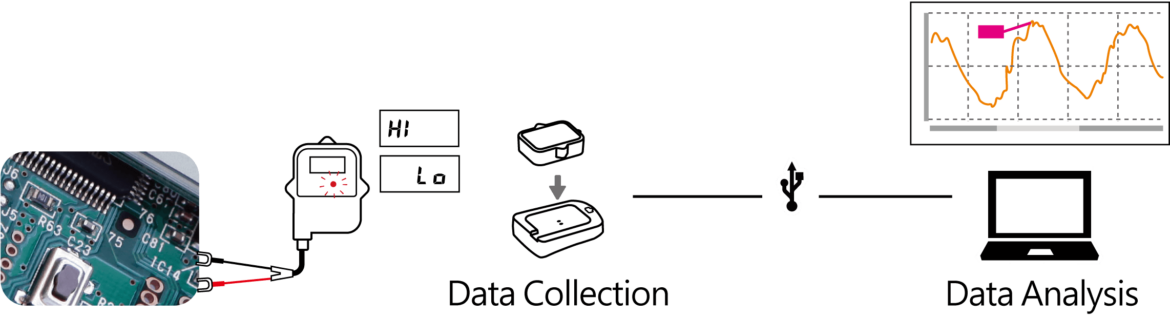
By connecting TandD’s Communication Port TR-50U2 to your PC via a USB cable or TR-57DCi Data Collector, you can easily download data by placing the logger face down on the port. Data downloaded to your PC can then be viewed and analyzed with the Windows-compatible software “T&D Graph.” When checking data on your PC, it is possible to apply scale conversion and view data values in the unit of your choice.


Software

The software included with the TR-5i series data loggers makes it possible to create detailed recording settings. Set the interval at which you want recording to occur and the timing at which you want the recording to start. When monitoring measurements for warnings the LED on the logger will flash and the time of the warning will be recorded.

Graphing software from TandD

The included graph application allows easy analysis of the recorded data. All data can be viewed in one graph window, regardless of the data format or from what type of device the data came from. Search and filter to get only the data you need. Data can be output as a text format file (CSV).